



Gantt Chart Software
for Project Management
Plan tasks, manage dependencies, and track project progress — connected to your resources in real time.
Visual Planning's Gantt charts give project managers and operations teams a clear, structured view of every project with task scheduling, dependency management, and resource workload all connected in one place.
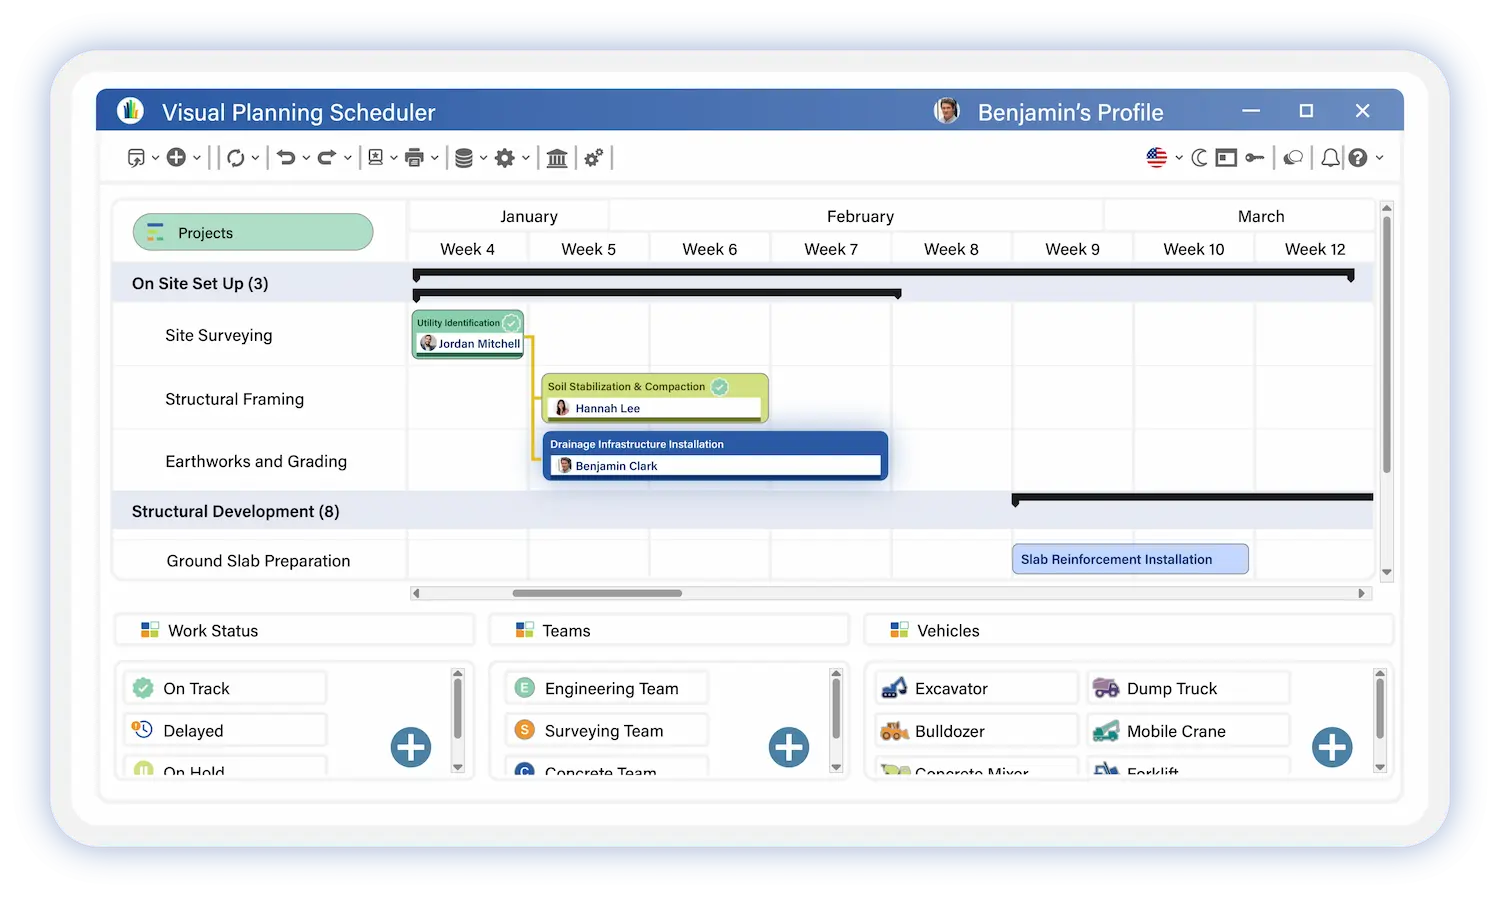
See Your Entire Project at a Glance
Task Scheduling
Organize tasks on a timeline to visualize their duration, sequence, and position within the project.
Dependency Management
Define relationships between tasks to coordinate every phase of the project in the right order.
Milestone Tracking
Identify critical milestones and track key dates to protect delivery deadlines across every active project.
Plan Every Project With the Flexibility Your Team Needs
isual Planning's Gantt charts adapt to every project structure and methodology.
✓ Schedule tasks with drag-and-drop directly on the timeline
✓ Organize project phases, work packages, and subtasks
✓ Define finish-to-start and start-to-start task dependencies
✓ Calculate the critical path automatically (CPM)
✓ Compare planned vs. actual schedule in one click
✓ Adjust timelines instantly when conditions change


Track Progress in Real Time
Visual Planning's Gantt charts give teams and managers live visibility into what is on track, what is complete, and what is at risk — without waiting for a status meeting.
✓ Active tasks and their current completion percentage
✓ Completed activities compared against the original baseline
✓ Delay risks and their impact on the critical path
✓ Upcoming milestones and delivery deadlines
This visibility lets project managers anticipate risks and adjust the schedule before delays become delivery failures.
Coordinate Teams and Resources Across Every Phase
Gantt charts in Visual Planning make cross-team coordination straightforward — every stakeholder works from the same project view.
✓ Visualize each team's responsibilities across every project phase
✓ Coordinate activities between departments and external contributors
✓ Plan resources needed at each stage of the project
✓ Track delivery timelines by team and by deliverable


Gantt and Resource Management — Connected
Visual Planning's Gantt chart connects directly to resource management and workload capacity views. This is what differentiates it from standard project planning tools.
Most Gantt tools show you the schedule. Visual Planning shows you the schedule and whether you actually have the capacity to execute it.
✓ Assign resources to tasks directly from the Gantt view
✓ Track team workload alongside the project timeline
✓ Detect resource overloads and conflicts before they delay delivery
✓ Adjust scheduling based on actual resource availability
✓ Optimize resource utilization across your entire project portfolio
Connects to Your Existing Tech Stack
Visual Planning connects to your ERP, CRM, HRIS, and business applications via open, secure REST APIs. Data flows automatically between systems — keeping every team working from accurate, current information with no duplicate entry.

Built for Every Role in the Organization
Visual Planning's Gantt charts can be used by various roles within the organization to improve project planning and team coordination.
Leadership and Managers
Track project portfolio progress and maintain a global view of every active initiative.
✓ Track overall project advancement across the portfolio
✓ Visualize critical milestones and delivery dates
✓ Identify delay risks before they impact business outcomes
✓ Manage strategic priorities across concurrent projects
Project Managers
Organize tasks, manage dependencies, and coordinate teams from one structured project view.
✓ Plan tasks, phases, and work packages with full dependency management
✓ Calculate and track the critical path automatically
✓ Compare planned vs. actual progress in real time
✓ Coordinate internal teams and external contributors
Resource Planners
Organize resources and anticipate capacity needs to keep project scheduling realistic.
✓ Manage workload distribution across all active projects
✓ Assign resources to tasks based on actual availability
✓ Anticipate capacity needs 3 to 12 months out
✓ Adjust scheduling when constraints or priorities change
Operations Managers
Track operational activities and improve cross-team coordination across projects and sites.
✓ Monitor operational activities across every active project
✓ Coordinate teams around a shared project schedule
✓ Identify potential delays before they impact operations
✓ Improve project organization and team alignment
Explore Other Visual Planning Features

Gantt Chart Views
Plan projects and track task dependencies with Gantt charts connected to resource management.
>

Kanban Boards
Organize tasks and visualize workflow progression at every stage of the process.
>
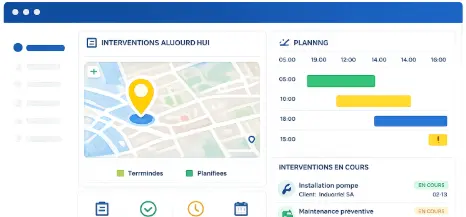
Geolocation
Supervise field teams and visualize resource locations on an interactive map.
>
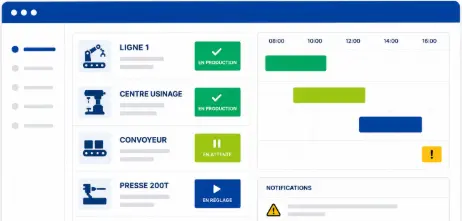
AI Planning Assistant
Analyze scheduling data and improve decision-making with VPPilot.
>

Automated Scheduling
Optimize activity planning with VPAutomation's automated sequencing and scenario simulation.
>

Dashboards and Reporting
Analyze projects and resources with customizable dashboards and real-time reports
>
Gantt Chart Software
Frequently Asked Questions
What is a Gantt chart?
A Gantt chart is a project management tool that displays tasks on a timeline with their duration, dependencies, and progress. It gives project managers and teams a structured view of the entire project — from the first task to final delivery — so everyone works from the same plan.
What is Gantt chart software used for?
Gantt chart software is used to plan project tasks across a timeline, define dependencies between activities, track progress against the original baseline, calculate the critical path, and identify delay risks before they impact delivery deadlines. In Visual Planning, Gantt charts also connect directly to resource management and workload capacity.
Can Visual Planning define task dependencies in Gantt charts?
Yes. Visual Planning supports finish-to-start and start-to-start dependencies between tasks. The critical path is calculated automatically so project managers always know which tasks control the final delivery date — and where to focus attention when conditions change.
How does Visual Planning track project progress in Gantt charts?
Visual Planning compares planned vs. actual schedule in real time. Delays and variances are detected automatically and surface as alerts before they impact critical milestones. Project managers see the full picture without running manual reports or waiting for team updates.
How is Visual Planning's Gantt chart different from Monday.com or Microsoft Project?
Monday.com is built for task tracking and team collaboration — its Gantt view shows the schedule but does not connect to resource workload or capacity. Microsoft Project offers advanced scheduling but operates as a standalone tool disconnected from live resource data. Visual Planning's Gantt chart connects directly to resource management, workload capacity, and real-time availability — so project managers see not just what needs to happen, but whether the team actually has the capacity to make it happen.
Can Visual Planning manage multiple projects in Gantt view simultaneously?
Yes. Visual Planning is built for multi-project portfolio management. Project managers get a consolidated Gantt view across every active project with shared resource tracking, cross-project conflict detection, and portfolio-level priority management — all from one platform.
Structure Your Projects. Protect Your Deadlines. Coordinate Your Teams.
Visual Planning gives project managers the Gantt chart they actually need — connected to resources, workload, and real-time priorities.