



Project Management Dashboards and Reporting
See your entire operation in one place. Act on what matters before it becomes a problem.
Visual Planning gives project managers, operations leaders, and HR teams real-time dashboards to track project progress, resource utilization, and team capacity — all from one interface, all connected to live scheduling data.

Clear Operational Visibility at a Glance
Project Progress
Track the status of every active project in real time. Identify gaps between planned timelines, critical milestones, and actual activity progress the moment they form.
Resource Utilization
Analyze resource allocation and team workload to optimize utilization and adjust scheduling before overloads impact delivery.
Performance Analysis
Generate consolidated reports and analyze project performance to track activity trends and maintain a global view of operations across the organization.
Customizable Dashboards Built Around Your Operation
Visual Planning's dashboards give every manager a complete view of project progress, resource utilization, and team workload — configured to their specific responsibilities.
Managers track in real time:
✓ Project progress against the original baseline
✓ Critical milestones and upcoming deadlines
✓ Resource utilization across every active project
✓ Team workload by department and time period
These indicators accelerate decision-making and keep every project on track.


Track Team Workload and Capacity Before Problems Hit
Visual Planning's dashboards give managers a clear picture of resource allocation and workload distribution. Imbalances surface automatically — before they impact project delivery.
✓ Overloaded teams and resources under capacity pressure
✓ Available resources and remaining capacity by period
✓ Upcoming capacity constraints before they create bottlenecks
✓ Underutilized periods to optimize before they cost margin
Analyze Project Performance Across the Organization
Visual Planning generates consolidated performance reports built directly from live scheduling data — so reports always reflect the real state of projects and teams, not last week's numbers.
✓ Overall project progress against objectives
✓ Team performance by project and time period
✓ Workload evolution trends over time ✓ Resource utilization trends over 6 to 24 months

Connects to Your Existing Tech Stack
Visual Planning connects to your ERP, CRM, HRIS, and business applications via open, secure REST APIs.
Data flows automatically between systems — keeping dashboards current without manual updates or duplicate entry.

Dashboards Built for Every Role
Visual Planning dashboards provide each team with a view tailored to its specific responsibilities.
Project managers, HR managers, and planners can monitor the metrics that enable them
to manage their operations effectively.
Leadership and Managers
Access the KPIs that matter for strategic decisions — without waiting for end-of-week reports.
✓ Track portfolio-level KPIs across every active project and program
✓ Monitor project and program progression in real time
✓ Make decisions backed by accurate, current data
Project Managers
Stay ahead of every risk and protect every deadline with live project dashboards.
✓ Track project progress against the original baseline
✓ Visualize critical milestones and upcoming delivery dates
✓ Identify delays and risks before they become delivery failures
Resource Planners
Optimize team utilization and anticipate capacity needs before they create scheduling pressure.
✓ Optimize team utilization across all active projects
✓ Anticipate capacity needs 3 to 12 months out
✓ Adjust scheduling in real time based on current workload data
Operations Managers
Get a consolidated view of operational performance to improve team efficiency across sites and departments.
✓ Track overall team performance by site and department
✓ Identify bottlenecks before they block operations
✓ Improve operational efficiency based on real performance data
HR Managers
Analyze team availability and ensure balanced workload distribution across the organization.
✓ Analyze team availability by department and time period
✓ Track human resource allocation across active projects
✓ Identify workload imbalances before they affect staff
✓ Optimize team organization based on reliable HR indicators
Explore Other Visual Planning Features

Gantt Chart Views
Plan projects and track task dependencies with Gantt charts connected to resource management.
>

Kanban Boards
Organize tasks and visualize workflow progression at every stage of the process.
>
Geolocation
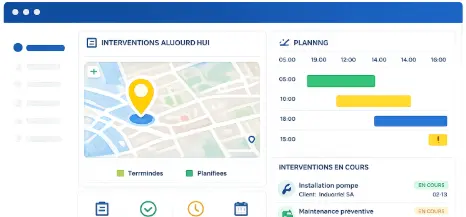
Supervise field teams and visualize resource locations on an interactive map.
>

AI Planning Assistant
Analyze scheduling data and improve decision-making with VPPilot.
>

Automated Scheduling
Optimize activity planning with VPAutomation's automated sequencing and scenario simulation.
>

Dashboards and Reporting
Analyze projects and resources with customizable dashboards and real-time reports
>
Project Management Dashboard Software
Frequently Asked Questions
What can you track with Visual Planning dashboards?
Visual Planning dashboards track the operational indicators that matter most for running your projects and teams — project progress, resource utilization, team workload, and available capacity. Because dashboards are fully customizable, each team displays the indicators most relevant to their specific responsibilities and operational context.
What does a project management dashboard do?
A project management dashboard gives managers a real-time view of task and milestone status, resource utilization, delay risks, and consolidated performance reports. In Visual Planning, dashboards connect directly to live scheduling data — so they always reflect the actual state of projects and teams, not outdated manual reports.
Can Visual Planning dashboards be customized by user?
Yes. Visual Planning lets every user configure their own dashboard — project managers, resource planners, HR managers, and executives each set up the indicators, views, and filters that match their responsibilities. No technical configuration required.
Can Visual Planning analyze multiple projects simultaneously?
Yes. Visual Planning provides a consolidated dashboard view across every active project. Managers filter by project, team, time period, or site and compare performance across projects — all from one platform without switching between tools.
Does Visual Planning integrate with other business systems?
Yes. Visual Planning connects to SAP, Oracle, Microsoft Dynamics, Salesforce, and 200+ other systems via REST API with real-time bidirectional sync. Data from your ERP, CRM, and HRIS feeds your dashboards automatically — no manual entry required.
Can dashboards be shared across teams?
Yes. Visual Planning dashboards are accessible from desktop, tablet, and mobile. Managers share specific views with team members based on role-based access permissions — each user sees only the indicators and data their role requires.
Your Scheduling Data Is Already There. Your Dashboards Should Help You Act on It.
Visual Planning centralizes all your operational data in clear, customizable, real-time dashboards — so you manage projects, resources, and teams with confidence.