If you are working in project management or have a position that involves scheduling tasks and resources, you probably already heard of the Gantt chart. I used to hear about it but without really knowing its true potential. Scheduling was just scheduling to me, scheduling a task or an employee at a certain period of time to make sure that everything is more or less on time. However, at some point I needed more than scheduling tasks in time.
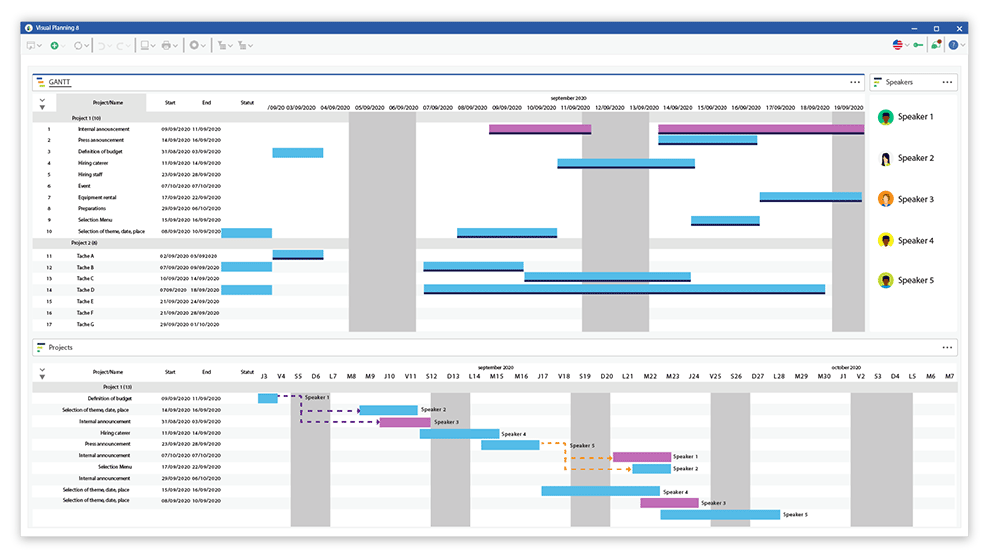
I needed to be able to be more productive, to forecast and enhance communication with the rest of the team. I needed the best possible execution of a project, and that’s when the Gantt chart became essential. By definition a Gantt chart, is a type of bar chart that shows the start and end date of several elements in a project such as tasks, activities, resources… Using a Gantt chart is like putting a bridge between your initial project plan and the execution level. The multiple benefits will clearly enable you to complete your project the best way.

INTUITIVE
Less is more as they say. That’s probably what the creator, Henry Gantt, thought when he created the chart. The basis, here, is simplicity: take a timeline, schedule all your activities. Then list all tasks then draw colored bares to show where each task starts and ends affect. That is it! Everybody understands this, the graphical overview and simplicity of the process make easy it to understand and use Gantt Charts. You will not need to send users to a scheduling/Gantt Chart beginner’s class. They can start from the minute they have a new project in mind.
ASSIGN RESOURCES EFFECTIVELY
The first and probably most obvious reason to use a Gantt chart is the ability to affect resource very effectively. With a Gantt chart you will have, at your disposal, a very clear view of all the activities scheduled, how long each activity is scheduled to last, where activities overlap with other activities and where each resources is placed… With all that no more resource wasting, you will be able to look ahead in your schedule and have all the information necessary to see when a specific resource will have to be allocated. All you need is a few minutes to think about it and affect the right resource to the right task.
AGILITY
Gantt charts allow you to set accurate deadlines. When you scheduled the whole project you were able to enter a starting date, a target end date, all the key dates or milestones in the middle, set a duration for each task… You sheduled the whole project and everything looks good so far. But what if something comes up unexpectedly? That is when using a Gantt chart becomes really interesting. When starting a project, there’s a great chance that unexpected events will come up and have an impact on your schedule. Gantt charts enable the scheduler to be very flexible, react quickly to unforeseen events, and modify the schedule. Gantt charts make it possible to develop visual scenarios to react very quickly to those unforeseen events, for instance, what happens to the second milestone if the first task lasts longer? That way, reactions quick changes on the schedule will be possible.
CLARITY & BETTER COMMUNICATION
In a project there are always two groups: the operation team and the management team. Operations need to be able to plan their work ahead and know what they are supposed to do next. Management needs to measure execution so they can provide an accurate “big picture” to project stakeholders. In other words, both groups need to communicate and, more importantly, to have the same information. The great thing about Gantt charts is that it speaks the language of both operation & management levels. Operations will have a great tool to schedule resources and a place to put all the information. Furthermore management has a single place to find out whether we are going to meet that deadline or not. Communication is, therefore, smoother and efforts can be, now, put towards the same goal. Moreover, it avoids misunderstanding or excuses and increases efficiency. Everybody has the same display, same deadlines, milestones and key dates; hence everybody is on the same page. Nobody can tell you they didn’t know their area of responsibility, or that they had a different due date.
STRAIGHT FORWARD REPORT MAKING
We all know that there is no activity without a report behind, which makes sense in our modern, data-driven professional lives. However, I have (almost) never met someone who thinks reporting is the greatest fun part of their job. Reports can be long and painful to create, by using a Gantt chart you will be clearly reducing the burden of that person (or you will be doing yourself a huge favor if you are the “report person”). As Gantt charts centralize all the information, they serve both as an operational and a reporting tool. For instance, you can report how much of the schedule has been completed. You can see the progress of a task directly on the bar in a specific color. Everybody is winning, here, the manager gets a great report very quickly. in parallel, the report person can allocate more time to other tasks.
POWERFUL INSIGHTS
One of the greatest reason to use a Gantt chart is the power of the insights you can get out of it. The scheduler gets guided by powerful and meaningful insights. As an example, you can get the total amount of time it will take you to accomplish a project. And, not only it gives you the possibility to visualize a sequence of events planned in your schedule, but a Gantt chart also enables the creation of a link between activities, also known as “dependencies”. A dependent task is tied to another one and you can only start once the first task is completed. There are also other types of dependencies, such as start to start, or finish to finish. Thanks to that you will be able to define the starting point of an activity once the previous one is achieved.
The Gantt chart easily displays all of this. As such you will know when you to start your next activity and see the tasks or activities that are crucial to the project and cannot be delayed without impacting the rest of the schedule. People can find many reasons not to use Gantt charts because they have also their limitations. If you need more elaborated features such as the ability to manage triple constraints, you might want to go for a project management solution that enables more than using a Gantt chart. Once again, you must define your needs from the moment you decided to buy a scheduling solution. However, Gantt Charts are a great way to handle scheduling very simply and easily. A bunch of scheduling solutions on the market offer such type of bar for scheduling, with great design and ergonomics, all you have to do is make a choice.


